The UK's Green Transition: Navigating the Path to Low-Carbon Prosperity

A global transition towards a cleaner, low-carbon economy implies that global demand for some products – such as fossil fuels and the power plants and combustion engines which burn them – will fall, while that for others – such as solar panels, wind turbines and electrolysers – will rise. Success in such a future economy depends on how well countries are able to adapt their productive capabilities to this new reality. Policy-makers are aware of this: for better or worse, industrial policy packages promoting clean technologies, such as the Inflation Reduction Act or the EU’s Net Zero Industry Act, tend to target domestic manufacturing capabilities quite explicitly.
There is plenty of evidence from research in economic geography and complexity to suggest that industrial development is path dependent: countries and regions more easily develop capabilities in sectors which are similar to what they are already good at producing (see Hidalgo et al., 2007 and Neffke et al., 2015). Moreover, countries which produce more technologically sophisticated products tend to fare better economically (Hausmann et al., 2006; Hidalgo and Hausmann, 2009).
How can these insights be applied to measure and predict competitiveness in new, “green” sectors? Mealy and Teytelboym (2022) introduce the Green Complexity Index (GCI), which measures the number and complexity of “green” products in which a country has revealed comparative advantage (RCA), i.e. exports more than the global average. “Green” products are identified in trade data using the OECD and WTO lists of green products. The paper also presents a measure of the ease with which countries are likely to develop future green capabilities: the Green Complexity Potential (GCP) measures countries’ proximity – i.e. similarity of existing productive capabilities – to green products in which it is not yet competitive.
In a more recent paper, we also developed the Brown Lock-in Index (BLI), which assesses countries’ transition risks based on the share of exports which are tied up in low-complexity, high-carbon products such as fossil fuels and internal combustion engines. We also proxy the ease with which countries are likely to be able to shift productive capabilities away from such declining activities using the (Green) Transition Outlook, which measures the similarity of brown exports to green and uncategorised products.
These indices, alongside more granular detail on competitiveness/lock-in to specific green/brown products, are presented in the Green Transition Navigator; an interactive web tool in which users can explore green competitiveness and brown lock-in over time. The underlying export data is averaged over rolling 5-year periods to avoid our measures being skewed by short-term fluctuations in trade. The data is based on the most recent version of CEPII’s BACI database and, following a recent update, covers the period from 1995-99 through 2018-22.
Last month’s update, which adds two time periods, broadly confirms existing trends. Germany retains its top rank in Green Complexity Index, which it has held throughout the period. The US used to be in second place, then held third place between 2011-15 and 2014-18, and has since shown a steady decline which leaves it at rank 6 in the most recent period. Italy is currently in second place, while China climbed from rank 25 in 1995-99 to rank 3 in 2018-22, overtaking Austria between 2017-21 and 2018-22.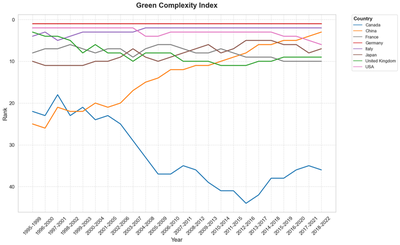
How does the UK compare to other advanced economies? It started out with GCI at rank 3 in 1995-99, but fell to rank 11 by 2010-14. Its GCI started to increase again in 2013-17 and has remained at rank 9 for the past 4 periods. Green Complexity Potential similarly declined from rank 5 in 1995-99 to 15 in 2015, then increased slightly to 14 in 2019 and has been at that level ever since. This overall loss of green manufacturing capability might reflect an overall fall in manufacturing competitiveness: the UK’s Economic Complexity Index (ECI) decreased from rank 7 to rank 19 over the period as a whole.
The UK has both strengths and opportunities across several environmental categories. Its highest average proximity is in the categories environmental risk management; environmental monitoring, analysis and assessment; and clean up or remediation of soil and water.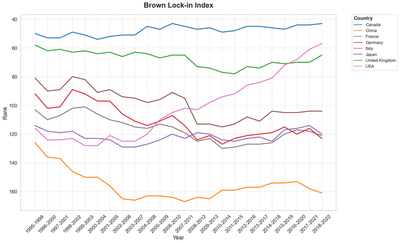
What about transition risks? Among the G7, the UK’s Brown Lock-in Index started out as the second-highest exceeded only by Canada with rank 58 in 1995-99. It fell to rank 78 in 2011-15, but increased again to 65 during the last period. The United States’ BLI has increased steadily for most of the period and now stands at rank 57, having overtaken the UK in 2016-20. The UK’s Transition Outlook is fairly average among the G7, with its overall Transition Outlook at rank 121 and Green Transition Outlook at rank 56. Brown products which account for a relatively large proportion of exports include mutton, cyclic hydrocarbons, internal combustion engines and gas containers.
The Green Transition Navigator allows for further exploration of these data.
There are several limitations to this analysis. Data on manufacturing exports does not include services or domestic production; nor does it take into account capabilities in emerging new technologies which may not yet be measurable in trade data. In order to maximise the number of time periods available for analysis, we rely on the 1992 nomenclature of the Harmonised System, which does not allow for the same level of precision in identifying some technologies as more recent editions. Most importantly, the WTO’s green list is vulnerable to the criticism of having been the result of a politicised, rather than a technical, process. There have been several attempts to more specifically map specific value chains (see e.g. Rosenow and Mealy, 2024; Serin et al., 2021; 2023). These and future efforts may coalesce into a more robust list of green products in future years.
Finally, what does the analysis – limitations notwithstanding – imply for policy? Proximity (or similarity) of a product or sector to a country’s existing capabilities give an indication of how easily the country is likely to develop capabilities in this area. The Product Complexity Index can further provide a proxy for how economically beneficial the product is likely to be. However, industrial policy may be needed the most where existing capabilities do not yet provide a clear path forward. Evidence on how to achieve such path-breaking diversification is, as of yet, sparse, and presents an exciting avenue for further research.